Live chat

Pages

Search This Blog

Friday 18 May 2018

AUD/CAD finds stiff resistance at 21-ema at 0.9673, good to go long on break above


  • AUD/CAD breaks above 5-DMA at 0.9624, trades 0.18% higher on the day at 0.9633 levels.
     
  • The pair finds stiff resistance at 21-EMA at 0.9673, breakout at 21-EMA could see further upside.
     
  • Technical studies are turning slightly bullish. Stochs have shown a rollover from oversold levels.
     
  • We also evidence bullish divergence on RSI and Stochs which adds to the bullish bias.
     
  • Breakout at 21-EMA will see test of 23.6% Fib at 0.9716. Further bullishness could take the pair to 50-DMA at 0.9811.
     
  • On the downside, we see major trendline support at 0.9550, break below will see resumption of weakness.
Support levels - 0.9624 (5-DMA), 0.96, 0.9550 (trendline)

Resistance levels - 0.9716 (21-EMA), 0.9785 (Nov 30 high), 0.9811 (50-DMA)

Recommendation: Watchout for breakout at 21-EMA to go long. Target 0.9716/ 0.9811.


USD/ZAR rejects key resistance at 12.62 Mark, bias remains slightly bearish


  • USD/ZAR is currently trading around 12.52 levels.
  • It made intraday high at 12.62 and low at 12.51 levels.
     
  • Intraday bias remains slightly bearish till the time pair holds key resistance at 12.62 mark.
     
  • A daily close above 12.62 will take the parity higher towards key resistances around 12.78, 12.86, 12.96 and 13.15 marks respectively.
     
  • Alternatively, a daily close below 12.42 will drag the parity down towards key supports at 12.20, 12.02, 11.94, 11.84, 11.70, 11.62 and 11.53 levels respectively.
     
  • Important to note here that 20D, 30D and 55D EMA heads up and confirms the bullish trend in a daily chart. Current downside movement is short term trend correction only.
We prefer to take short position on USD/ZAR  around 12.55, stop loss at 12.62 and target of 12.42/12.20.

GBP/JPY trade idea


  • GBP/JPY is continuing its upward momentum and jumped almost 80 pips from Wednesday close. The pair has closed slightly above 200- day MA and this confirms minor trend reversal. It has jumped till  jumped till 150 at the time of writing The yen was trading weak against all majors today on account of easing geo political tensions . USD/JPY trades higher and hits high of 111. GBP/JPY has taken support near trend line and any minor weakness only below 147.05. It is currently trading around 149.72.
     
  • The pair is facing strong resistance at 150 and any convincing break above 150 will take the pair to next level till 150.64 (100- day MA)/151/152.80.
     
  • On the lower side, near term major support is around 149 and any decline below will drag the pair to next level till 148/147.
It is good to buy on dips around 149.50-60 with SL around 149 for the TP of 150.64/151.
Resistance
R1- 150
 
R2 –150.65
 
R3- 151.50
Support              
 
S1- 149
 
S2-148
 
S3- 147

EUR/NZD breaks below 20-dma, on track to test 50-dma at 1.70, stay short


  • EUR/NZD extends slump below 20-DMA, on track to test 50-DMA at 1.70.
     
  • The pair is trading in a rising channel pattern and is extending downside after rejection at channel top.
     
  • The pair has formed a 'Shooting Star' at highs and we see scope for further weakness. Bears now target 50-DMA at 1.70.
     
  • Technical indicators are turning bearish and violation at 50-DMA will see further weakness.
     
  • Stochs are showing a rollover from overbought levels and RSI has turned lower from near overbought levels.
     
  • Break below 50-DMA will take the pair lower till next major support at 110-EMA at 1.6925 ahead of channel base at 1.6740.
     
  • On the flipside, retrace above 5-DMA will see test of channel top at 1.7285. Break out at channel top negates bearish bias.
Support levels - 1.70 (50-DMA), 1.6925 (110-EMA), 1.6813 (Mar 13 low)

Resistance levels - 1.7164 (5-DMA), 1.72, 1.7285 (channel top)


USD/CHF downside capped by 20 –day ma, good to sell on rallies


  • Major resistance – 1.0060
     
  • USDCHF has shown a minor decline till 0.99575 and started to recover from that level. The pair almost formed almost a double top at 1.00560 and started to consolidate within narrow range. Any convincing break below 0.9945 (20- day MA) confirms minor weakness and a dip till 0.9900 is possible.
     
  • The pair’s further bullish continuation can be seen only above 1.0060 level. Any break above 1.0060 will take the pair to next level till 1.010/1.0170 level. The safe haven such as yen has been declining sharply  
  • In this week the pair jumped till 1.00415 and started to decline from that level. So intraday trend is still weak and any convincing close below 1.000 confirms minor bearishness.
It is good to sell on rallies around 1.0020-25 with SL around 1.0060 for the TP of 0.9905.

EUR/USD daily outlook


  • EUR/USD is consolidating in narrow range and trading slightly weak 25 pips above 2018 low. The pair pared some of its gains in European session. The pair weakness was mainly due to rising US 10 year bond yield. The yields hits fresh 7 year high at 3.10% yesterday. The leaders of Italy’s two political party M5S and League agreed to form a government. So no threat for Euro. It is currently trading around 1.17862.
     
  • The number of new people filing for U.S jobless benefits increased more than expected. Initial claims for unemployment benefits rose to 222K
    compared to forecast of 215k.
     
  • On the higher side, near term major intraday resistance is around 1.1850 (hourly Kijun-Sen) and any break above will take the pair to next level till 1.1875 (200- H MA)/1.19215 (23.6% fibo)/1.1950. Short term bearish invalidation only above 1.2020 (200- day MA).
     
  • The near term support is at 1.1750 and any convincing break below will drag the pair to next level till 1.1715/1.1660.

nse tips biocon

biocon 1st target achieved@630

nse tips bank nifty

bank nifty 1st target achieved@25900

nse tips ongc

buy@ 182 day high@192

nse tips boicon

sell biocon @636 sl 642 target 630/624

nse tips sun pharama

buy sunpharma  @485 sl 480 target 490/495/500

nse tips hindpetro

sell hindpetro @317 sl 321 target 313/309/304

nse tips bank nifty

sell bank nifty@26000 sl 26100 target 25900/25800

Wednesday 16 May 2018

UPDATE 1-Suspected Indian central bank interventions stems rupee's fall

 Indian rupee unexpectedly gains on strong RBI intervention
* India bonds also gain taking comfort from rupee
* Rally at risk as macro risks, high oil weigh (Adds details, quotes, bond level)
By Suvashree Choudhury
MUMBAI, May 16 (Reuters) - Suspected currency market intervention by the Reserve Bank of India for a second consecutive day stemmed the rupee's fall, three dealers said after seeing heavy dollar selling from the outset of trade on Wednesday.
The rupee INR=D2 had weakened to a 16-month closing low of 68.15 per dollar on Tuesday, but after the latest round of suspected central bank support it had bounced back to 67.80, despite the dollar's strength on international markets.
"It looks like RBI is in a mood today," said a senior dealer at a state-run bank, estimating that within the first 10 minutes the RBI might have sold $300 million to $400 million proactively to prevent any sharp fall in the rupee.
Sharply rising U.S. dollar yields have boosted the dollar on international exchanges, and the rupee was also coming under pressure from firm crude oil prices that will weigh on India's already widening trade deficit.
Some dealers had anticipated that the RBI might refrain from intervening on Wednesday as it suspected intervention on Tuesday had failed to stop the rupee hitting its weakest level since January 27, 2017.
The rupee swung in nearly one percent intraday range on Tuesday, its most volatile day in about a year. can understand what the RBI wants to do with the rupee. It says it intervenes to curb volatility but sometimes it allows the rupee to move wildly and sometimes it is holding it with a heavy hand," said another dealer at a foreign bank.
Indian bond prices strengthened on the rupee's unexpected recovery.
The 10-year benchmark bond yield < IN071728G=CC stood at 7.88 percent early compared with its previous close of 7.90 percent.
However, both forex and debt traders were doubtful whether the rally in the rupee and Indian bonds would last through the week.
Indeed, bond dealers expect the yield on 10-year paper to cross the 8-percent mark, a level unseen since June, 2015, due to inflation concerns.
Forex traders also expect the rupee to breach the record low 68.8650 level, last touched on November 24, 2016.
"It is quite difficult to sustain the rally given India's weakening macro-economic parameters," said another dealer at a foreign bank.
Indian rupee has been the worst performer in the region, losing more than 5 percent so far in 2018 while inflation risks have increased on high oil prices raising the probability of faster hikes in interest rates by the RBI.
The trade deficit <INTRD=ECI > widened to $13.72 billion in April from $13.25 billion a year ago and could rise further with India importing 80 percent of its oil needs.

mcx copper tips

sell copper@ 461 target 456

mcx tips aluminium tips

sell aluminium @158.90 sl 160target 157.6/156

mcx crudeoil tips

sell crude oil @4825 sl 4860 target 4790/4760/4730

nse tips heromotors jack pot call

sell hero motors@ 3580 sl 3650 target 3510/3440/3360

Gold's Bearish Breakout-In-Progress Confirms USD Strength

More than any other asset, gold invokes strongly defended positions among both its proponents and detractors. Whether you believe gold is “historically the only true form of hard money” or “just a yellow rock with few industrial uses,” it still pays to keep an eye on the price action and evaluate the current trend.
For more than two years, gold hasn’t shown much of a trend at all, with prices consolidating between $1200 and $1400 (excluding a brief spike down to the mid-$1100s in Q4 2016). More recently, the metal has spent the entire first third of 2018 trapped between $1300 and $1365, frustrating bulls and bears alike.
That may be changing with Tuesday's price action: as of writing, gold was trading hands below $1300, down by more than 1.5% on the back of a breakout in US Treasury yields and the accompanying greenback rally:

Daily Gold
Daily Gold
Of course, bears have been wrong-footed by failed breakouts before, so it may be worthwhile to wait for a daily close to confirm the breakdown. That said, gold is currently trading well below the 50% retracement of the December-January rally, opening the door for a continuation down toward the 61.8% ($1286) or 78.6% ($1264) retracements next. Astute readers will note that the 1260 area provided support twice back in October of last year.
Taking a step back, Tuesday’s breakout-in-progress serves as a confirmatory indicator of the recent dollar strength. From an intermarket perspective, as long as gold remains below $1300, it will support the near-term “bullish dollar” thesis.


The Coming Copper Crunch


Copper had one of its best years ever in 2017, rising 27% on the back of supply disruptions and steady demand from China, by far the largest copper consumer.
Commodities analysts are usually wrong about copper supply, always predicting a glut in the market for the ubiquitous metal used in everything from piping for plumbing to wiring in houses, to components of electric vehicles. What they fail to account for is the inevitable stoppages at the major copper mines due mostly to strikes and weather problems.
In 2017 however they were right. In January last year a collection of analysts—from BMI, Goldman Sachs, Citigroup) and TD—were all bullish on copper, saying that after a terrible 2015 and 2016, it would be the strongest performing metal of 2017 with predictions of up to $6,200 a tonne come mid-year. By the end of 2017 copper futures trading on the London Metal Exchange (LME) were at their highest in four years, $7,236.50 a tonne or $3.28 a pound. Copper wasn’t the best performing metal of 2017 (that would be cobalt) but it was third behind palladium.
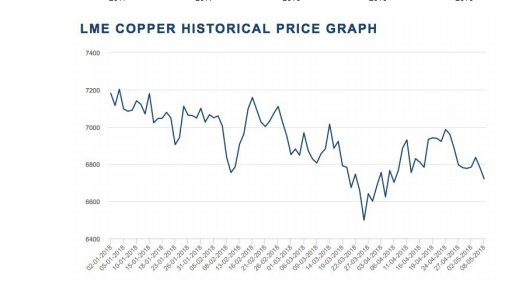
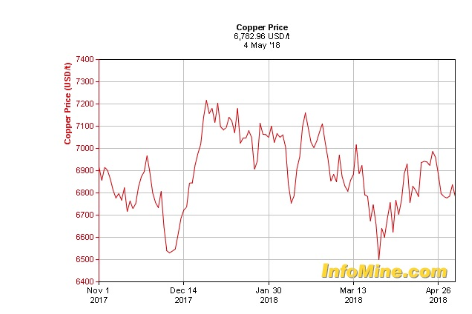
So how has copper done so far in 2018? The base metal is showing a V-shaped curve, with LME copper starting the year at $7,200 a tonne, bottoming out at $6,499 on March 26, and currently trades at $6,721. Spot copper follows the same pattern. It started 2018 at just under $7,200 and was at $6,782 ($3.08) as of May 4. Copper has traded up sharply since the end of March but has pulled back since the end of April.
Copper Price in USD
Copper Price in USD
LME Copper, Historical Price Graph
So what's happening with the copper market and what are the prospects for junior copper companies wanting to find the next big discover to be gobbled up by a major? The article embedded below takes a look at the copper market in detail, including uses, the supply-demand trends and pricing.
However, the overall conclusion, based on the details provided, is that copper is heading for a major shortfall. That can only mean one thing: higher prices

mcx gold tips

gold 31100 pe bought @90 day high 196.50

Tuesday 15 May 2018

comex gold targets extended

gold short @ 1324 booked all positions @1302 but it will test 1284

our call profits


nse tips gail sell call

gail 1st target done 339 sold@ 346 

nse tips jack pot call

buy apollo tyres @290 sl 282 target 298/306/314

nse tips jackpot call

sell havells @545 sl 565 target 520/500/480/460

nse tips buy hdfc

buy hdfc@1940 sl 1925 target 1955/1970

nse tips gail sell call

sell gail @ 346 sl 353 target 339/332/325

nse tips lt 1st target achieved

L&T buy given@ 1390 maid high 1404.80

nse tips jindal steel 1st target achieved

jindal steel buy given @ 260 maid high 264.95

nse tips berager paints

berger paints buy@ 278 maid high 281.70

nse tis infy 1starget achieved

infy buy given @ 1180 1st target done @1195

comex gold tips

comex gold 1st target achieved @ 1314

nse tips tatamotor dvr

tata motors dvr 1st target achieved @188

Monday 14 May 2018

Bitcoin Daily Forecast - 14 May 2018

Bitcoin outlook negative despite a bounce in oversold conditions. We are holding strong resistance at 8650/8750 and should turn lower. Holding below 8600 targets 8500 and 8350 before the low at 8210/00. A break lower is expected eventually targeting 7800 and the the most important of the week at 7550/7500. We should bounce off here on the first test to ease oversold conditions. I do not think this level will hold for ever though.
Strong resistance at 8650/8750 but shorts need stops above 8850. An unexpected break higher targets 8900/8950 and 9050, perhaps as far as 9180/9200, but look for a selling opportunity at 9250/9300.

Crude Oil Prices Up After Geopolitical Issue Eases

The oil prices were bullish in the market as geopolitical tensions in the Middle East dies down. The commodity’s prices managed to hit another milestone despite the astonishing performance of the dollar in the market.
The commodity continues to push great performance in the market on multiple factors. The great oil inventories reports and the OPEC agreement to extend the output cut have managed to put the prices on its best figures ones again.
Furthermore, the recent decision from the Trump administration was the last greatest factor that managed to buoy the oil prices in the market. The administration recently announced their plan to revokes the nuclear deal with Iran, easing some of the geopolitical tension and debacle in the Middle East.
The tension mostly came from the Iran and U.S.A. deal which also dragged the commodity’s prices down in the market this week. Most of the pressure came from the announcement of the U.S.A. about rethinking the possibility of leaving the Iran nuclear deal which will, in return, severely affect the ongoing oil exports from the country.
Oil Prices
Both the Brent Crude and the U.S. West Texas Intermediate were tallying greater returns in the market today. The Brent crude managed to increase by a massive 19 cents in the previous session, settling at a $77.40 a barrel.
The West Texas Intermediate or WTI also managed to hit the lucrative $71 per barrel price on the same market session. The deliveries for June in the New York Mercantile Exchange also managed to increase by a total of 22 cents, settling at $71.36 a barrel.
Furthermore, the oil price increases just after the Treasury Secretary expressed his thoughts on the oil prices on a previous report. Secretary Steven Mnuchin noted that he is not expecting a huge market movement in the coming session as countries is reportedly increasing their output to offset some of the losses they experienced.
Last week’s oil prices were also pressured after their tremendous run. The stockpiling oil inventories are looking to take hold of the oil prices this week as they keep pestering the global stock figures. According to reports, the Oklahoma storage hub was up by a total of 479,644 barrels to the terrifying 39.56 million barrels.
Analysts are also looking for the possibility of the oil prices running unexpectedly wild. Some of reports and analysis are pointing that the prices may hit the $100 price per barrel just before the year ends.

mcx nickel tips

nickel 3rd target achieved

mcx nickel tips

nickel 3rd target achieved @ 972

mcx nickel tips

nickel 2 nd target achieved @966

Gold: Outlook For The Week Of May 13th, 2018

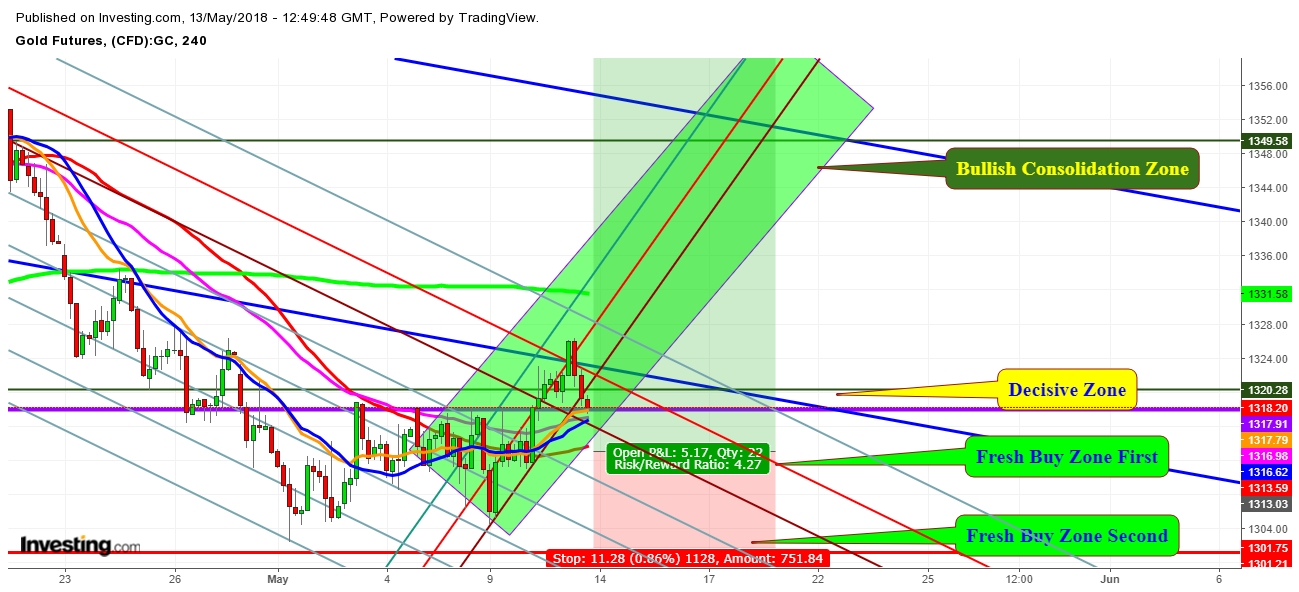
Since my last analysisGold futures have found good support at the level of $1318 and look ready to retreat towards $1329 and further to $1355 levels during the upcoming week.
I expect Gold futures to move in the following trading zones during the week of May 13th, 2018.
Gold  Futures 4 Hr. Chart - Expected Zones For The Week Of May 13th,2018
Gold Futures 4 Hr. Chart - Expected Zones For The Week Of May 13th,2018
Disclosure
1. This content is for information and educational purposes only and should not be considered as an investment advice or an investment recommendation. Past performance is not an indication of future results. All trading carries risk. Only risk capital be involved which you are prepared to lose.
2. Remember, YOU push the buy button and the sell button. Investors are always reminded that before making any investment, you should do your own proper due diligence on any name directly or indirectly mentioned in this article. Investors should also consider seeking advice from an investment and/or tax professional before making any investment decisions. Any material in this article should be considered general information, and not relied on as a formal investment recommendation.

NG Looks To Consolidate In Upper Range During Week Of May 13th, 2018

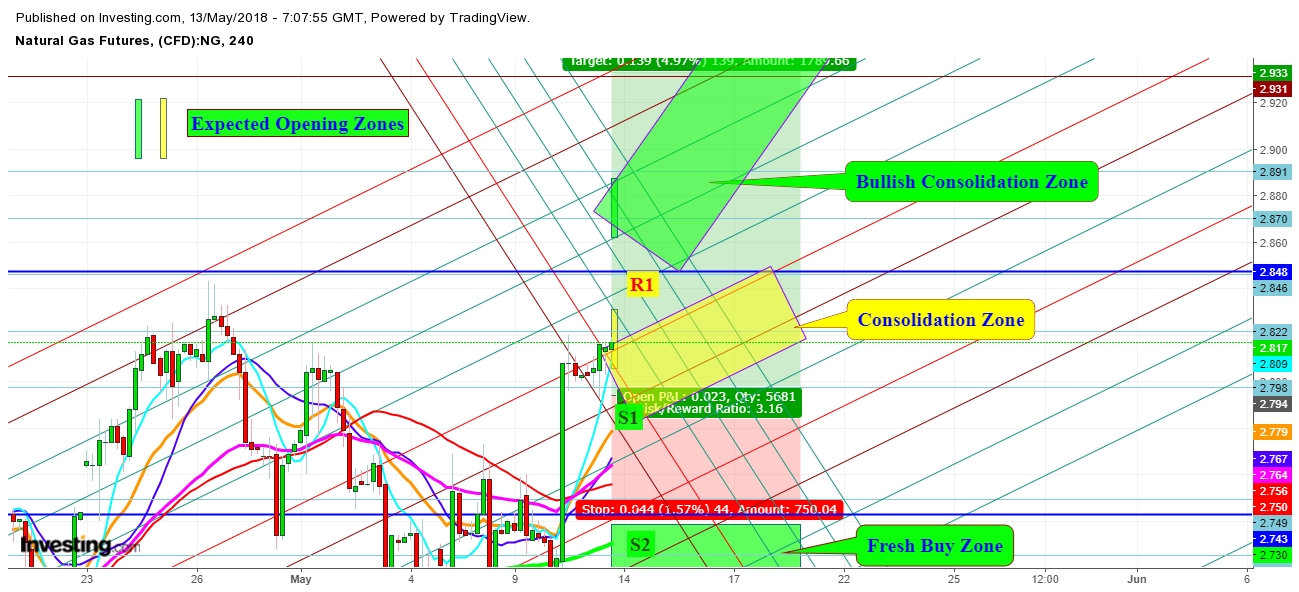
Since my last analysis, I've found that Natural Gas Futures look ready to consolidate in an upper range now. Amid the expected impact of supply and demand, the equation is about to tilt from decreasing demand during winter to growing demand with the above-average temperatures covering most of the country through mid-May. No doubt that the record high domestic production levels have overshadowed the fact that gas stocks are well below their seasonal averages for this time of year. Such scenario during mid May to last week of June always results in growing volatility.
I expect the Natural Gas futures to move in the following trading zones during the week of May 13th, 2018.
Natural Gas Futures 4 Hr. Chart - Expected Trading Zones For The Week Of May 13th, 2018

Disclosure
1. This content is for information and educational purposes only and should not be considered as an investment advice or an investment recommendation. Past performance is not an indication of future results. All trading carries risk. Only risk capital be involved which you are prepared to lose.
2. Remember, YOU push the buy button and the sell button. Investors are always reminded that before making any investment, you should do your own proper due diligence on any name directly or indirectly mentioned in this article. Investors should also consider seeking advice from an investment and/or tax professional before making any investment decisions. Any material in this article should be considered general information, and not relied on as a formal investment recommendation.

EUR/USD: Sell Climax Bouncing To 1.2000

The EUR/USD daily chart collapsed in a series of sell climaxes. The odds favor a bounce to resistance at the 20-day EMA and the top of the most recent leg in the climax. That leg was the 4-bear bars down to the low of 2 days ago.
The EUR/USD daily Forex chart is in a strong bear trend. Yet, because it has fallen in a series of strong bear legs within a tight bear channel, the selloff is climactic. That is a parabolic wedge sell climax. There is a 60% chance of a rally to the top of the most recent small leg in the climax. That is the top of the 4 final bear bars, and it will be around the 20 day EMA.
Furthermore, a bounce from a sell climax usually has at least 2 small legs and lasts about half as long as the sell climax. Since the selling took place over 4 weeks, the 150 – 200 pip sideways to up move will probably last at least a couple of weeks.
Is the bottom in? When a bear channel is tight, the bulls usually need some kind of micro double bottom before they can get their rally. Therefore, there will probably be at least a small pullback in the bear rally within a few days. That will qualify as a micro double bottom and be the start of a small 2nd leg up.
Parabolic wedge bottoms have a 30% chance of reversing into bull trends without a major trend reversal bottom. Therefore, there is a 70% chance that the rally over the next 2 weeks will either be a bear flag or a bull leg in a trading range.
In either case, there will probably be a test down to around this week’s low. Since there is important support down at the December 12 low of 1.1717 and the November 5 low of 1.1553, the odds favor lower prices over the next couple of months.

Weekly Chart Forming A Reversal Bar

The 2-day reversal has turned the bar on the weekly chart into a reversal bar. The market is now trading around the open of the week. If the day closes above this week’s open, the weekly bar will have a bull body.
While this week’s reversal is good for the bulls, the 2 weeks before were big bear trend bars. Consequently, this week will probably not be enough for the weekly bull trend to resume. Instead, it will probably lead to a pause in the selling for a couple of weeks. The odds are that the bulls will need at least a micro double bottom on the weekly chart before the bulls can regain control.
In addition, the strong December rally begin with the 1.1717 low. The odds are that the weekly chart will have to get there over the next month or so before the bulls will have a reasonable chance of regaining control on the weekly chart.

Overnight EUR/USD Forex Trading


The EUR/USD 5-minute Forex chart rallied about 60 pips overnight. Since this rally is either a bear flag or a bull leg in a trading range, it will probably be weak. Yet, the odds favor higher prices over the next 2 weeks. Consequently, the bulls will buy selloffs.
Furthermore, since the bears know that the daily chart is still in a bear trend, they will sell rallies. Both the bulls and bears know that a trend up or down on the daily chart is unlikely for at least 2 weeks, both will be mostly scalping for 20 – 30 pips.
The swings will soon get smaller, and day traders will then have to scalp for 10 pips. Swing trading bulls will buy dips and hold for a test of 1.2000. Swing trading bears will probably wait for a test of resistance at around 1.2000

sell crude oil

sell crude oil@ 4750 sl 4790 target 4710/4680

buy nickel

buy nickel @ 954 sl 948 target 960/966/972

buy mcx gold 31000 pe

buy mcx gold 31000 pe @ 90 target 200/300/400

SHORT COMEX GOLD

SELL COMEX GOLD@ 1320 SL 1326 TP 1314/1308/1302

nse tips infy

buy infy @ 1180 sl 1165 target 1195/1205/1210

nse tips L&T

buy L&T 1390 sl 1375 target 1405/1420/1435 

nse tips tatamotors dvr

sell tata motors dvr@ 193 sl 198 target 188/183

nse tips jindal stel Futures

buy jindal stel @ 260 sl 255 target 265/270/275

nse tips Hexa wear

1st target achieved sell give @430 

nse tips berger paints

buy Berger paint@278 sl 274 target 282/286/290

nse tips

sell hexa wear @ 435 target 425/420/415

Followers

gold tips

sell gold @ 56860 sl 57100 target 56600/56400/56500