The Q1 2018 meeting of the Incrementum Fund’s Advisory Board took place on January 24, about one week before the recent market turmoil began. In a way it is funny that this group of contrarians who are well known for their skeptical stance on the risk asset bubble, didn’t really discuss the stock market much on this occasion. Of course there was little to add to what was already talked about extensively at previous meetings. Moreover, the main focus was on the topic presented by this meeting’s special guest, Gianni Kovacevic.
Gianni believes that oil has a bleak future as a fuel for transportation, as he expects the trend toward adoption of electrical vehicles to accelerate – not least because government mandates to this effect have begun to proliferate. This trend should in turn boost long term demand for copper, as the existing electrical infrastructure will have to be adapted to cope with rising demand for electricity.
We have to admit that we are personally still a bit skeptical with respect to this particular notion. While it is clear that government mandates and subsidies for “clean energy” have multiplied well beyond the nuisance level in many countries, we harbor grave doubts about the ability of government decrees to trump issues of economic viability.
Gianni’s main argument is though that while oil prices are likely to be capped by the fact that advances in extraction technology (i.e., fracking) have created a source of supply that can be rapidly switched on and off as needed, a similar revolution has not taken place with respect to copper supply. On the contrary, not only were there very few new copper finds due to investment drying up over the past decade, mine development has become such an onerous and time-consuming process that it is hard to see how there can be a rapid reaction in terms of supply additions should hitherto unexpected demand growth materialize.
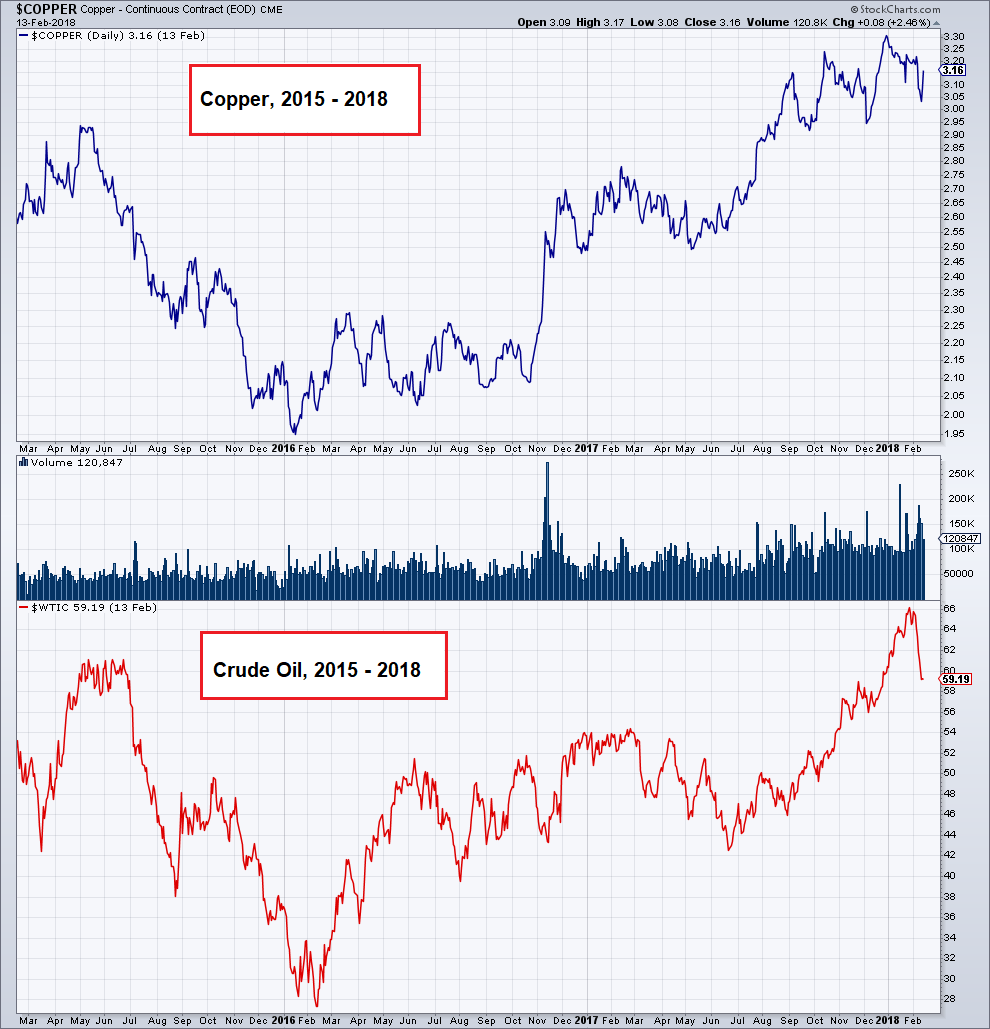
Over the past three years, copper and crude oil have moved in tandem, reflecting both the vagaries of the USD exchange rate and perceptions about global economic growth.
Indeed, as the chart included in the transcript shows (the transcript is available for download below), the number of significant mineral discoveries between 2011 and 2017 in both the precious metals and industrial metals categories has shrunk more dramatically than in any commodities bear market since at least 1975.
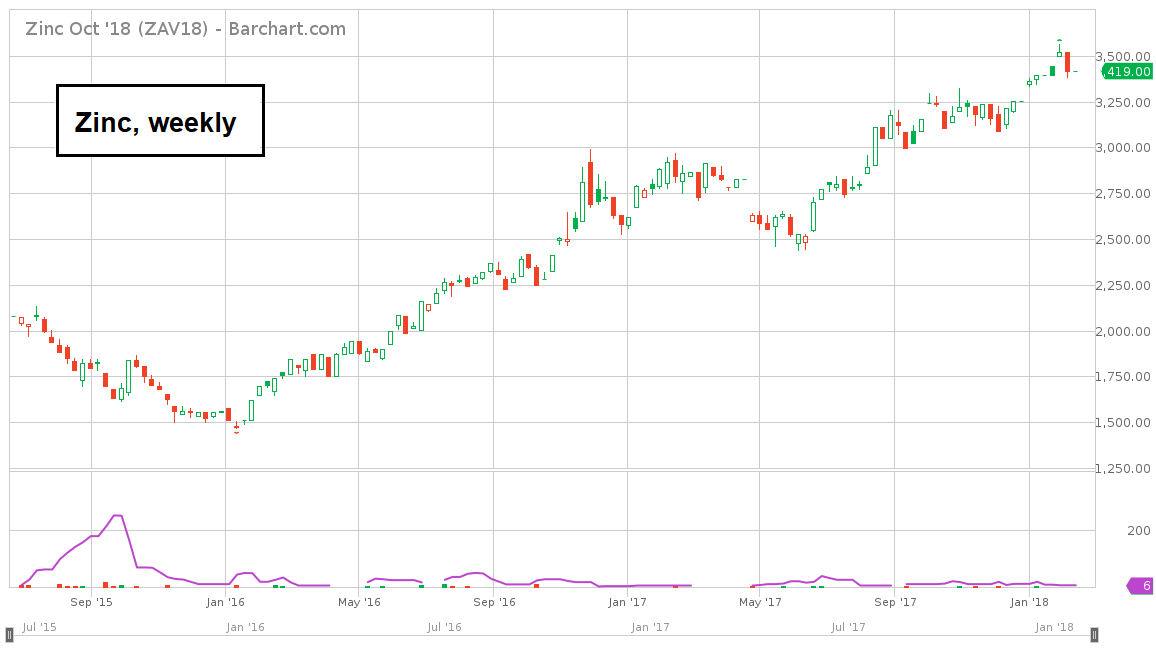
Due to the unique stock-to-flows situation in gold and silver, the dearth of discoveries is not as significant for the prices of these two metals as it is for those of base metals. If one looks at the action in some of the less liquid base metals such as e.g. zinc in recent years, one can see that a relatively small shift in perceptions about demand can indeed have an outsized effect on prices under such circumstances.
Zinc, weekly – since putting in a low in early 2016, zinc prices have made an explosive move higher.
We believe that faltering money supply growth will fairly soon lead to slowdown in economic activity, which should dampen growth expectations and eventually lead to a time-out in the commodities rally. The rally should resume once falling asset prices scare our vaunted central bankers into embarking on yet another printathon. Until that happens though, there is a good chance that recent trends will become even more pronounced (as a side note to this: we believe the agricultural sector is very close to joining the uptrend in other commodity prices).
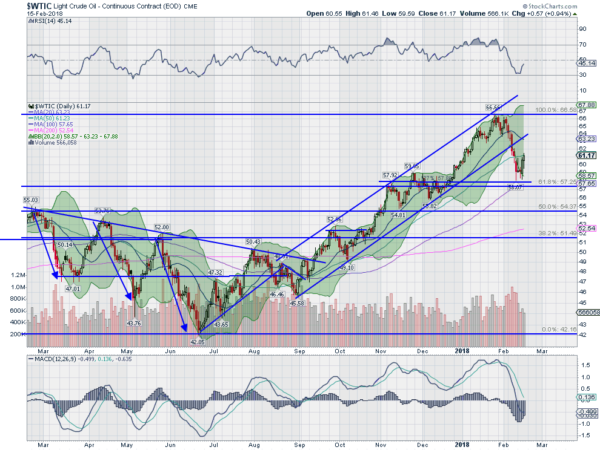
We will discuss crude oil in a separate post soon, as structural imbalances have built up in this market that definitely deserve a very close look – not least because they represent a medium term warning sign for the “reflation” narrative. For now it is clear though that price inflation is indeed beginning to accelerate just as monetary inflation has slowed quite drastically.
The Inflation Debate
What is currently happening on the “price inflation” signals front was discussed at the meeting as well. The proprietary Incrementum Inflation Indicator at the moment signals that a trend toward rising price inflation has become firmly entrenched – this was incidentally confirmed by the US CPI release this morning. Readers may recall that we have talked about the theory espoused by our previous guest speaker Ben Hunt with respect to price inflation in a period of monetary tightening in a series of recent posts entitled “Business Cycles and Inflation” (see Part 1 and Part 2 for the details).
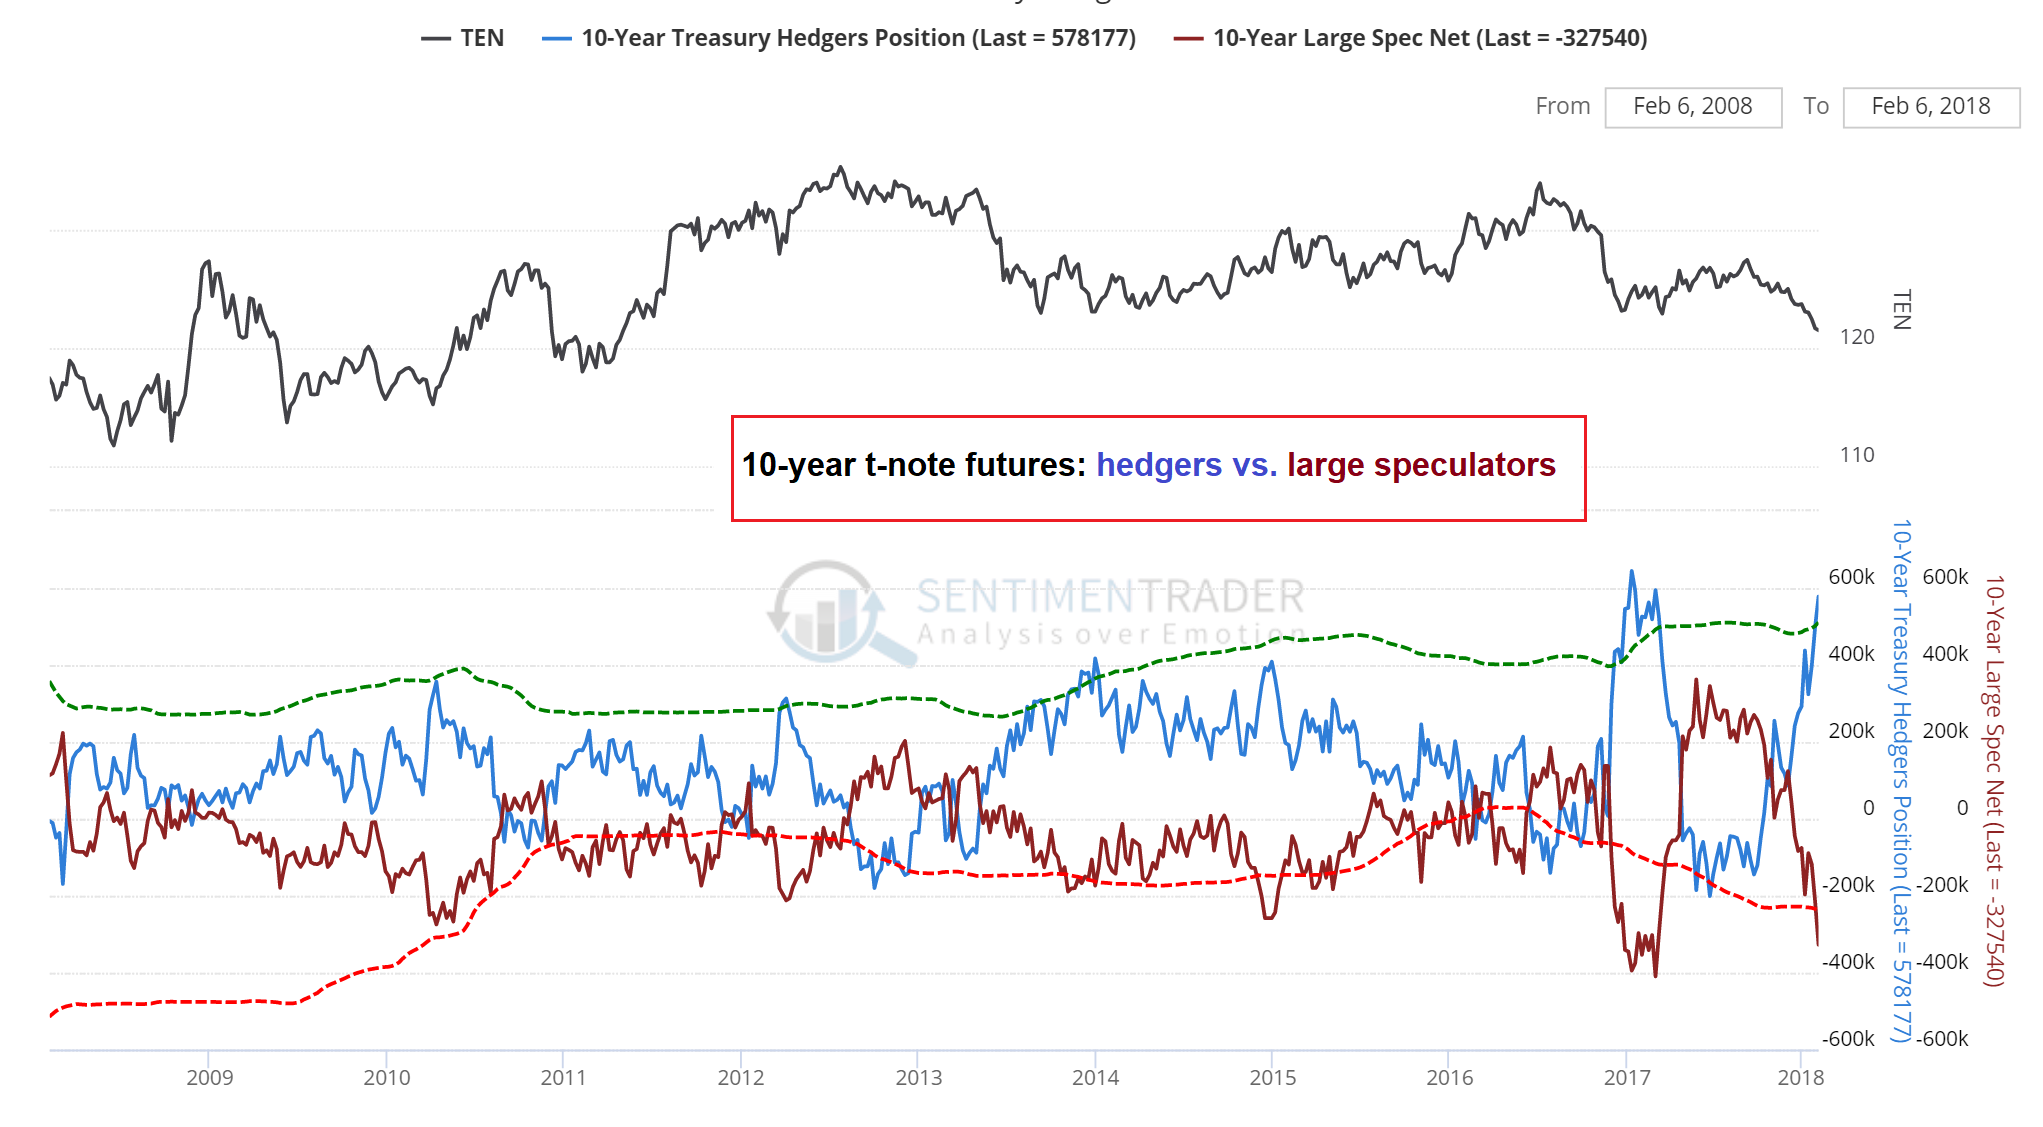
Jim Rickards presented the other side of the inflation story by noting that long-term disinflationary/deflationary forces actually remain in place. He is bullish on treasuries, if for the moment only relative to German Bunds. We definitely agree on this point, in fact, treasuries appear to be close to becoming an outright buy on market structure grounds as well. Speculators hold an extraordinarily large net short position in t-note futures at present and they have been notoriously wrong when placing such large bets over the past decade – although it seems to us that they may be a bit more lucky this time, at least in the short to medium term.
Net positions of commercial hedgers and large speculators in 10-year note futures – over the past decade, speculators as a group have been notoriously wrongly positioned at virtually all minor and major turning points in this market. Obviously, the position as such does not tell us anything about the next turning point, but its size suggests that this market has become highly vulnerable to a violent snap-back rally. What might trigger it? Our guess is that perceptions about economic growth will change as the effects of the slowdown in money supply growth begin to show up in the data from Q2 onward. On the other hand, there is a chance that this time, speculators will remain lucky for longer, as the recent firming in price inflation could prove to be sticky for a while.
Was Wednesday's unexpectedly high CPI reading a last hurrah? Not necessarily in our opinion – we will revisit this point in more detail in our next market update. For now let us just say that there is an interesting theory as to how things may play out in the equity and bond markets in coming months that is tied to the trend in “price inflation” as reflected by CPI and reconciles some of the contradictions we have recently observed in various economic and market-related signals.


